6. Benchmark results
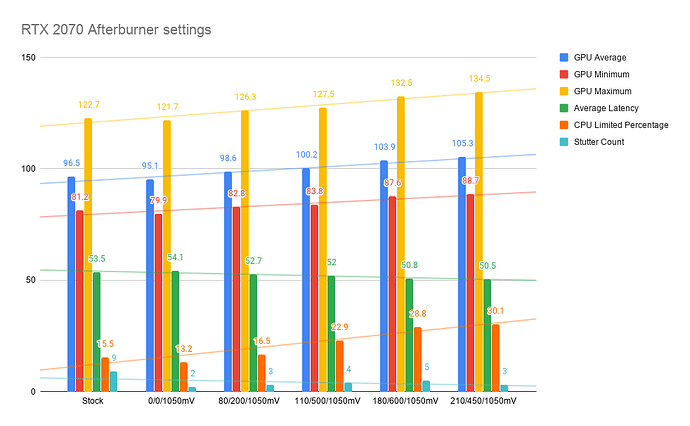
The chart below details various overclocking profiles with results from the Forza Horizon 4 benchmark.
- Each group is labeled either [Stock[ or with [Core Offset/Memory Offset/Voltage].
- GPU Average (higher is better)
Average FPS rendered by the GPU - GPU Minimum (higher is better)
Minimum FPS rendered by the GPU - GPU Maximum (higher is better)
Maximum FPS rendered by the GPU - Average Latency (lower is better)
Frame latency rendered by the GPU - CPU Limited Percentage (higher is better)
= 100% minus the GPU Limited Percentage.
We are overclocking the GPU in order to reduce the GPU bottleneck, putting more load on the CPU. - Stutter Count (lower is better)
A couple of things to note…
- While locked voltage with no overclock technically performed worse than stock, performance is much more consistent equating to a much better gaming experience. Frame rate isn’t everything.
- Stutter count dropped significantly after locking the voltage, but continued to increase with each overclock. Dropping the Memory Clock reduced the Stutter Count again.
- Compared to the stock GPU, CPU Limited Percentage increased from 15.5% to 30.1%.
That equates to double the amount of time that the CPU was the limiting factor when rendering frames. - Minimum FPS rose about 9.2% from stock, which is huge.
On a slower card this could be the difference between having sub-60 FPS to having consistent 60 FPS or higher.
